The figure shows the position–time (x – t) graph of one–dimensional motion of a body of mass 0.4 kg. The magnitude of each impulse is 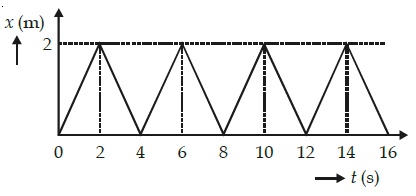
0.2 Ns
0.4 Ns
0.8 Ns
1.6 Ns

The figure shows the position–time (x – t) graph of one–dimensional motion of a body of mass 0.4 kg. The magnitude of each impulse is