
The graph below depicts the earnings of A and B over the period 2000 to 2010:
From the graph, which one of the following can be concluded?
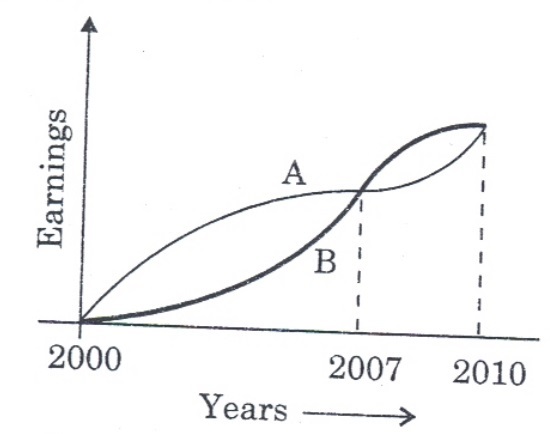
On the average A earned more than B during this period.
On the average B earned more than A during this period.
The earnings of A and B were equal during this period.
The earnings of A were less as compared to B during this period.